
Andrey Dyomin
First Deputy Director General for Economic Affairs and Finance, JSC ROSSETI
Ensuring the financial stability of JSC ROSSETI and its subsidiaries in the current macroeconomic environment, increasing the Company’s operating efficiency, and reducing its operating and investment expenditures were the previous year’s top priorities for the financial and economic unit of the Company.
The financial results were affected by the revaluation of assets, JSC ROSSETI’s subsidiaries that worked in 2014 amid “frozen” grid tariffs, restrictions on access to debt capital markets, increased costs of electrical equipment (both foreign and domestic), a higher key rate of the Bank of Russia, an increase in receivables, and a number of other aspects that adversely affected the appeal of grid companies for investors and, consequently, their share prices.
To change the situation and improve the financial stability of ROSSETI’s grid companies for the last three years, JSC ROSSETI has put forward initiatives to amend government regulation on the electricity industry, including establishing long-term transparent regulatory rules, resolving the issue of last mile agreements, reducing cross-subsidies, introducing economically feasible network connection fees without increasing the tariff burden on all consumers of electricity distribution services, imposing of penalties for unpaid services in the retail electricity market similar to those in the wholesale market, establishing the institution of “financial guarantees” for grid companies, causing suppliers of last resort to be responsible to grid companies to the same extent as to the wholesale market, and setting up uniform settlement centers in the regions.
Approved in 2014, the Long-Term Development Program of JSC ROSSETI also provides for a number of measures to enhance the financial stability of electric grid companies and their appeal among investors.
Due to limited access to the Western debt capital markets, ROSSETI started to explore the possibility of approaching the Asian markets and encouraging investment from this region. Negotiations with financial and investment institutions of China, Hong Kong, and some other countries will continue into the following year.
MD&A
Consolidated Key Financial Indicators
Consolidated revenue rose by 0.5% year-on-year to RUB 759.6 bln compared with RUB 755.8 bln earned by the ROSSETI Group in 2013. The upward trend is due to increased revenue from electricity distribution services.
Adjusted EBITDA¹ for the reporting period totaled RUB 249 bn that is 6.8% higher compared with the previous reporting period. EBITDA margin increased up to 32.8% that is higher than in 2013 on 2 p.p.
Adjusted profit² for the reporting period slightly decreased by 6.1% compared with 2013 totaling RUB 69.5 bln as a result of high rate of increase in amortisation due to the launch of new property, plant and equipment as part of the investment programme.
Free cash flow rose by 883% on 2013 to RUB 20.7 mln as a result of an RUB 11.7 mln (7.9%) increase in the Company’s cash flows from operating activities and a decrease in net cash flows from investing activities.
¹ Adjusted EBITDA is calculated as EBITDA (profit for the accounting period before taxes, interest expenses and depreciation) excluding losses from impairment of fixed assets, financial investments and receivables.
² Adjusted Net profit for the reporting period is calculated as Net profit for the period excluding losses from impairment of fixed assets, financial investments and receivables and deferred income tax expense related to them.
|
Key financial indicators, mln RUB |
2013 |
2014 |
Change |
|---|---|---|---|
|
Revenue |
755,806 |
759,608 |
0,5 |
|
Operating expenses |
(912,566) |
(759,805) |
(16.7) |
|
Other income, net |
7,939 |
14,309 |
80.2 |
|
Adjusted EBITDA |
233,162 |
249,029 |
6.8 |
|
Loss for the period |
(159,389) |
(24,257) |
(84.8) |
|
Adjusted net profit |
73,999 |
69,499 |
(6.1) |
Revenue
Consolidated revenue increased by 0.5% year-on-year to RUB 759.6 bln. The ROSSETI Group’s revenue is determined by changes in electricity consumption (in 2014 electricity demand rose by 0.4%) and electricity transmission and distribution tariffs.
Revenue structure for 2013 and 2014 is represented in the table and diagrams below
|
Revenue, mln RUB |
2013 |
2014 |
2014/2013,% |
|---|---|---|---|
|
Electricity transmission |
580,656 |
620,022 |
6.8 |
|
Network connection services |
37,005 |
36,473 |
(1.4) |
|
Electricity resale |
127,063 |
86,516 |
(31.9) |
|
Other revenue |
11,009 |
12,484 |
13.4 |
|
Government subsidies |
73 |
4,113 |
- |
|
TOTAL |
755,806 |
759,806 |
0.5 |
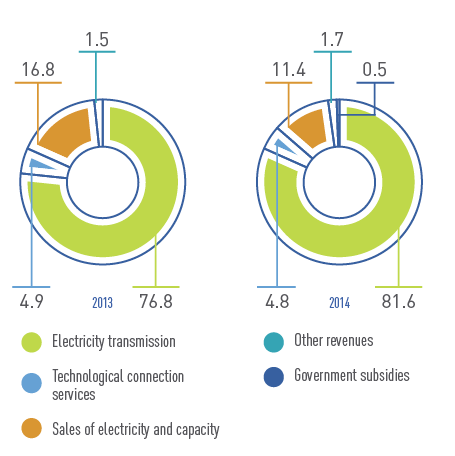
Revenue from electricity transmission and distribution rose by 6.8% to RUB 620 bln due to the June 1, 2013, tariff increase. Considering the decrease of revenue from the sale of electricity share, Revenue from electricity transmission and distribution amounted over 82% of the consolidated Group revenue in 2014.
The share of technological connection in the Company’s revenue shrank by 18.7% mainly due to the provision of technological connection services to consumers at reduced tariffs and the implementation of a roadmap for improving the infrastructure accessibility approved by the government of the Russian Federation.
Group revenues from the sale of electricity decreased by 31.9% to RUB 86.5 bln compared with RUB 127.1 bln in 2013. The decrease was related to the transfer in 2014 by certain ROSSETI subsidiaries the function of guaranteed supplier to external companies that had won guaranteed supplier tenders in accordance with the resolution of the Russian Ministry of Energy.
Operating expenses
Operating expenses decreased by 16.7% to RUB 759.8 bln in 2014, primarily as a result of reducing of recognized impairment losses of property, plant and equipment and reducing of purchased electricity for resale costs due to the transferring by certain ROSSETI subsidiaries the function of guaranteed supplier to external companies.
|
Operating expenses, mln RUB |
2013 |
2014 |
2014/2013,% |
|---|---|---|---|
|
Personnel costs |
150,193 |
155,155 |
3.3 |
|
Depreciation and amortization |
115,942 |
125,910 |
8.6 |
|
Impairment of property, plant and equipment |
239,446 |
81,690 |
(65.9) |
|
Material expenses, including: |
189,310 |
167,607 |
(11.5) |
|
Purchased electricity for compensation of technological losses |
101,135 |
92,098 |
(8.9) |
|
Purchased electricity for resale |
60,164 |
46,834 |
(22.2) |
|
Production work and services, including: |
142,060 |
144,384 |
1.6 |
|
Electricity transmission |
122,437 |
125,445 |
2.5 |
|
Repairs, maintenance and installation services |
14,607 |
14,302 |
(2.1) |
|
Impairment of trade and other receivables |
19,892 |
18,872 |
(5.1) |
|
Taxes other than income tax |
9,733 |
14,738 |
51.4 |
|
Provisions |
1,665 |
12,043 |
623.3 |
|
Other expenses |
44,325 |
39,406 |
(11.1) |
|
TOTAL operating expenses |
912,566 |
759,805 |
(16.7) |
|
TOTAL operating expenses excluding depreciation of fixed assets and impairment of accounts receivable |
653,228 |
659,243 |
0,9 |
In addition, the dynamics of operating expenses excluding depreciation of fixed assets and impairment of accounts receivable grew by 0.9% to 659.2 billion rubles compared with 2013. The growth was significantly impacted by higher amortisation (due to the introduction of new facilities as part of the investment programme), personal costs increase due to salary indexation for industrial personnel in accordance with the effective Branch Agreement and increased headcount at sites as part of the implementation of the investment programme. At the same time other reserves balance rose by 10.4 billion rubles due to accrued reserves for estimated liabilities in connection with litigation from territorial grid companies relating to electricity transmission and power distribution companies relating to electricity sales to compensate for technological losses. A considerable increase of 51% in taxes and levies, except for profit tax, is largely because of property tax payable by FGC UES and MOESK due to amendments to tax legislation (gradually abolished tax relief on property related to power lines since January 1, 2013)
Operating Profit and adjusted EBITDA Analysis
Implementation of measures to improve operating efficiency and reduce operating expenses enabled ROSSETI Group to increase operating efficiency and level negative impact of external macro economical factors and growing of beyond the control of management costs.
Adjusted EBITDA analysis
Adjusted EBITDA increased to RUB 249.0 bn, which is higher than the previous year by RUB 15.9 bn, or 6.8%. Adjusted EBITDA margin grew by 32.8% that is 2.0 pp higher than the previous year. The increase of Adjusted EBITDA resulted at Implementation of measures to improve operating efficiency and reduce operating expenses as part of the Company’s performance management programme with stable revenue volume.
|
Adjusted EBITDA analysis, RUB bln |
2013 |
2014 |
|---|---|---|
|
Loss for the period |
(159,389) |
(24,257) |
|
Depreciation and amortization |
115,942 |
125,910 |
|
Interest expenses |
15,885 |
23,973 |
|
Income tax benefit/(expense) |
(31,012) |
6,208 |
|
EBITDA |
(58,574) |
131,834 |
|
Adjustments: |
291,736 |
117,195 |
|
Adjusted EBITDA |
233,162 |
249,029 |
|
Adjusted EBITDA margin |
30.8% |
32.8% |
Segment revenues
The Group has fourteen reportable segments, as described below, which are the Group’s strategic business units. Each strategic business unit offers electricity distribution services, including technological connection services, in a separate geographical region of the Russian Federation and is managed separately.
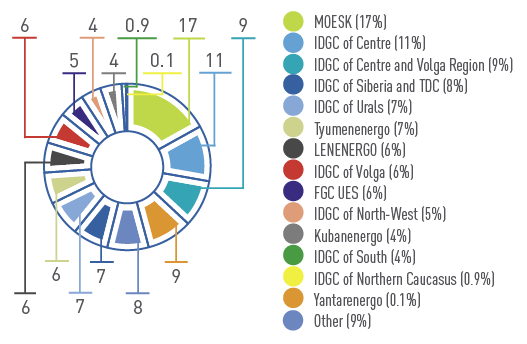
A significant share of revenue from external customers in consolidated Group revenue is taken by MOESK (17%) and IDGC of Centre (11%). Whereas revenue from external customers of FGC UES consists only 6%, the major part of FGC UES’s revenue amounts in revenue from other Group’s SDCs.
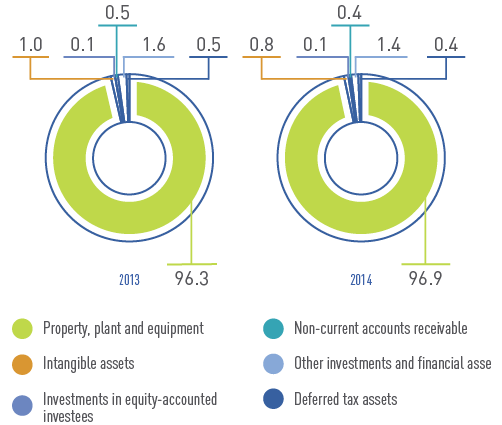
Assets
Non-current assets increased by 2.0% in 2014 to RUB 1,696.6 bln. Changes in non-current assets consisted in the higher value of fixed assets, lower value of other investments and financial assets.
Property, plant and equipment grew by 3.0% in 2014 to RUB 47.7 bln, primarily due to the commissioning of new facilities as part of the investment programme.
Total other investments and financial assets in 2014 decreased by RUB 4.3 bln (16% down) due to the revaluation of financial investments (shares in Inter RAO) at current market value as of December 31, 2014.
Deferred tax assets in 2014 decreased to RUB 1.9 bln in 2014, which was substantially due to the recognition of expenses associated with impairment of property, plant and equipment, to provisioning for contingencies in connection with litigation from territorial grid companies relating to electricity transmission and power distribution companies relating to electricity sales to compensate for technological losses.
|
Indicators, RUB mln |
2013 |
2014 |
2014/2013,% |
|---|---|---|---|
|
Property, plant and equipment |
1,595,862 |
1,643,586 |
3.0 |
|
Intangible assets |
16,557 |
14,300 |
(13.6) |
|
Investments in equityaccounted investees |
1,202 |
1,627 |
35.4 |
|
Non-current accounts receivable |
7,442 |
6,971 |
(6.3) |
|
Other investments and financial assets |
27,309 |
22,952 |
(16.0) |
|
Deferred tax assets |
9,012 |
7,117 |
(21.0) |
|
Total non-current assets |
1,657,384 |
1,696,553 |
2.4 |
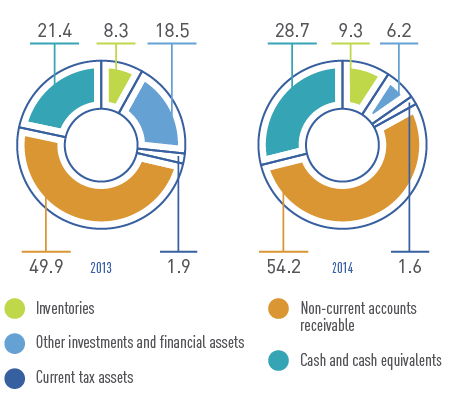
The structure of the Company’s current assets in 2014 is characterized by the following changes:
- In the reporting period, inventories grew by 11% and reached 9% of total current assets. The increase in inventories was due to higher costs of building materials and to a quantitative growth in inventories in consequence of certain parts of work switching over to using in-house resources for repair operations;
- Short-term receivables were up by 8%, which is comparable with the increase in revenue for the period;
- Other investments and financial assets decreased by RUB 35 bln in 2014, or 66% due to the closing of short-time deposits.
|
Indicators, RUB mln |
2013 |
2014 |
2014/2013,% |
|---|---|---|---|
|
Inventories |
23,920 |
26,630 |
11.3 |
|
Other investments and financial assets |
53,306 |
17,908 |
(66.4) |
|
Current tax assets |
5,568 |
4,636 |
(16.7) |
|
Trade and other receivables |
143,944 |
155,776 |
8.2 |
|
Cash and cash equivalents |
61,917 |
82,576 |
33.4 |
|
Total current assets |
288,655 |
287,526 |
(0.4) |
Equity and Liabilities
The structure of equity remained almost unchanged in 2014.
Structural changes in the Company’s equity resulted from retained earnings decreased by the amount of the loss.
|
Indicators, RUB mln |
2013 |
2014 |
2014/2013,% |
|---|---|---|---|
|
Share capital |
163,154 |
163,154 |
0 |
|
Share premium |
212,978 |
212,978 |
0 |
|
Treasury shares |
(2,819) |
(2,725) |
(3.3) |
|
Other reserves |
(6,265) |
(3,981) |
(36.5) |
|
Retained earnings |
398,711 |
383,554 |
(3.8) |
|
Total equity attributable to equity holders of the Company |
765,759 |
752,980 |
(1.7) |
|
Non-controlling interest |
295,932 |
285,824 |
(3.4) |
|
Total equity |
1,061,691 |
1,038,804 |
(2.2) |
Considerable part of non-current liabilities in 2014 was represented by loans and borrowings (85,7%).
Non-current liabilities in the reporting period decreased by RUB 11.2 bln, or 2%, and reached RUB 563.1 bln at the end of 2014. Considerable changes were materially due to RUB 6.8 bln or 1.4% decrease in loans and borrowings, specifically as a result loan maturity changed from long-term to short-term .
The 11.2% decline in deferred tax liabilities was due to lower deferred tax liabilities related to fixed assets in consequence of the recognized losses of their impairment in 2014.
Financial Stability and Loan Portfolio
As of December 31, 2014, the Company’s consolidated net debt slightly increased by 2% on the previous year to 496 billion rubles.
Analysis of Gross Debt
|
Indicators, RUB mln. |
31.12.2013 |
31.12.2014 |
Changes |
|---|---|---|---|
|
Long-term debt |
492,229 |
485,409 |
(1)% |
|
Short-term debt |
57,808 |
93,227 |
61% |
|
Gross debt |
550,037 |
578,636 |
5% |
|
Long-term debt, % |
89% |
84% |
5 pp. |
|
Net debt |
488,120 |
496,060 |
2% |
|
Adjusted EBITDA |
233,162 |
249,029 |
6.8% |
|
Net debt/ adjusted EBITDA |
2.1 |
2.0 |
(0.1 pp.) |
The amount of short-term debt related to loans and borrowings increased by 61% to RUB 93.2 bln as of December 31, 2014. The rise in net debt is due to both an increase in the Group’s loan portfolio resulting from short-term borrowings to finance the capital investment program and the revaluation of the Group’s debt obligations denominated in foreign currency.
Credit Ratings
The Company is active in cooperating with leading international rating agencies: Moody’s, Standard & Poor’s, and Fitch Ratings. In accordance with the methodologies of the international rating agencies,
JSC ROSSETI and its SDCs qualify as government-linked companies. Consequently, the credit ratings of the Group’s entities are closely tied to the sovereign rating of the Russian Federation.
Against a background of instable foreign policy, sanctions against some Russian entities and individuals, and the deteriorating economic situation, the international rating agencies in 2014 revised the sovereign rating for the Russian Federation and the credit ratings for Russia’s largest companies, including the ROSSETI Group’s entities.
The creditworthiness of the ROSSETI Group’s entities was not revised by any rating agency, which indicates the Group’s stable financial position
In February 2014, Moody’s reaffirmed the credit ratings of JSC ROSSETI at Ba1; JSC FGC UES at Baa3; and JSC LENENERGO; JSC MOESK; IDGC of V olga, JSC; IDGC of Urals, JSC; and IDGC of Center and V olga Region, JSC at Ba2; all with a stable outlook. However, during the year, the agency changed several times its outlook for the Group’s credit ratings. Due to the deteriorating economic situation and the lowered ceiling ratings for Eurobonds on Russian companies and their foreign currency deposits, Moody’s placed all of the Group’s credit ratings under review for downgrade on December 23, 2014.
|
Company |
Current Credit Rating |
Initial Assignment Date |
||||
|
Moody’s |
S&P |
Fitch |
||||
|
JSC ROSSETI |
Ba1 |
ВВВ- |
– |
July 2010 / March 2014 |
||
|
JSC FGC UES |
Ваа3 |
ВВВ- |
ВВВ |
February 2006 |
July 2004 |
October 2013 |
|
JSC MOESK |
Ва2 |
ВВ |
BB+ |
October 2007 |
January 2012 |
August 2013 |
|
IDGC of Centre, JSC |
– |
ВВ |
– |
November 2009 |
||
|
IDGC of Volga, JSC |
Ва2 |
– |
– |
October 2012 |
||
|
IDGC of Center and Volga Region, JSC |
Ва2 |
– |
– |
October 2012 |
||
|
IDGC of Urals, JSC |
Ва2 |
– |
– |
October 2012 |
||
|
JSC LENENERGO |
Ва2 |
– |
– |
November 2009 |
||
In 2014 Standard & Poor’s initially assigned an international investment grade credit rating to JSC ROSSETI. The rating of the Company is relevant to sovereign credit rating
On March 27, 2014, Standard & Poor’s gave JSC ROSSETI a BBB- international credit rating with a negative outlook.
On April 28, 2014, Standard & Poor’s downgraded by one notch the credit rating of JSC FGC UES to BBB- with a negative outlook due to the lowering of the sovereign rating of the Russian Federation to the same level.
On December 30, 2014, Standard & Poor’s placed under review for downgrade the credit ratings of JSC ROSSETI (BBB-), JSC FGC UES (BBB-), JSC MOESK (BB), and IDGC of Centre, JSC (BB). Previously, the agency had placed under review the rating of the Russian Federation.
Receiving credit ratings from international credit rating agencies enables the Company and its subsidiaries to be increasingly attractive to investors and pursue an effective borrowing policy in public capital markets
|
Indicator/Ratio |
2013 |
2014 |
Change |
|
EBITDA adj. margin |
30.85% |
32.78% |
6.3% |
|
Net Debt/ EBITDA adj. |
2.1 |
2.0 |
(0.1) |
|
Current ratio |
0.93 |
0.75 |
(19.4%) |
|
Quick ratio |
0.85 |
0.68 |
(20.0%) |
|
Leverage |
0.83 |
0.91 |
9.6% |
|
Total Assets turnover |
0.39 |
0.38 |
(2.7%) |
|
Long-term loans/gross debt |
89% |
84% |
(5 pp.) |
Tariff Regulation
Characteristics of Tariff Regulation
The tariff policy in the electric grid sector is aimed at ensuring longterm and transparent tariff regulation.
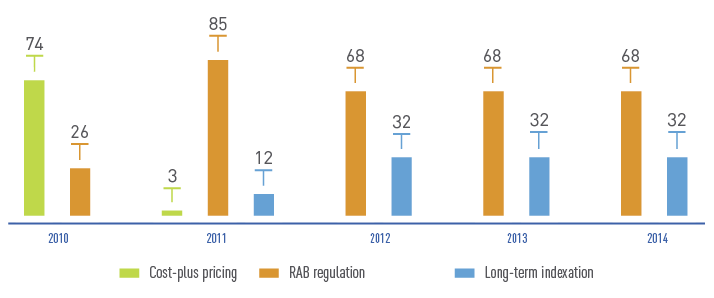
At present, ROSSETI SDCs are subject to long-term tariff regulation methods: return on invested capital method (RAB) and long-term minimum regulated revenue indexation method.
|
Return on Invested Capital Method |
Long-Term Minimum Regulated Revenue Indexation Method |
|---|---|
|
An organization’s minimum regulated revenue is set for a long-term |
|
|
|
In the case of the long-term minimum regulated revenue indexation method, the main components of minimum regulated revenue are controllable expenses and uncontrollable expenses, including expenses associated with depreciation of fixed assets and expenses related to using reinvested profit. Reinvested profit may not be in excess of 12% of a grid organization’s minimum regulated revenue.
Inherent in the return on invested capital method is the possibility of a phased payback plus interest on invested capital. Therefore, the benefits of the transition to RAB regulation are that returns are guaranteed, thus encouraging investment in grid infrastructure construction and modernization, and that it is possible to make more investments compared with the long-term minimum regulated revenue indexation method.
The calculation base for electricity transmission and distribution services is the volume of electricity delivery and the amount of capacity determined in accordance with the Rules of Nondiscriminatory Access to Electricity Transmission and Distribution Services and the Provision Thereof and the consolidated forecast electricity (capacity) balance.
The distribution of costs in the electricity distribution tariff in 2014 was marked by an increase in costs incurred by other territorial grid organizations and by a decrease in costs associated with compensation for electricity losses
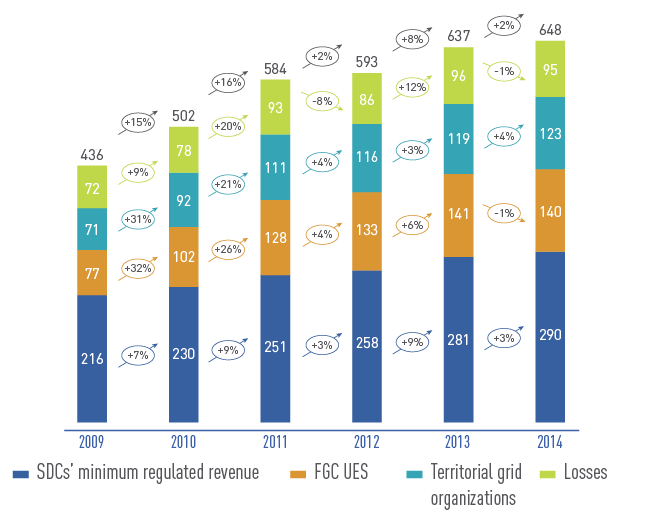
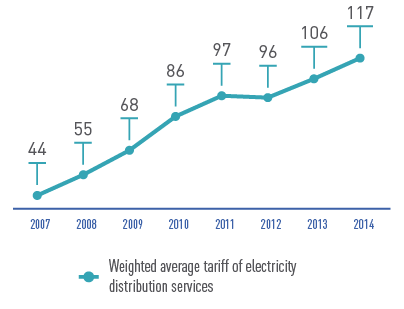
The weighted average pool tariff in the existing agreement system was 1.17 rubles per kWh in 2014, or 10% higher than in 2013.
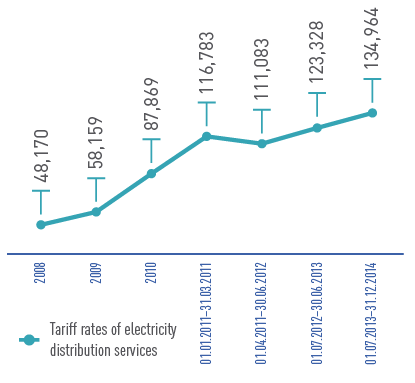
The tariff rate of electricity distribution services related to maintenance of UNEG electric grid facilities did not change on July 1, 2014, and was 135,000 rubles per MWm in the reporting period.
The Problem of Last Mile Agreements
The last mile mechanism consists in leasing out the equipment of the Unified National (All-Russian) Electric Grid’s (UNEG’s) facilities to which the power-receiving equipment of electricity consumers is connected to territorial grid organizations.
In accordance with Federal Law No. 308-FZ of November 6, 2013, “On Amendments to the Federal Law ‘On the Electric Power Industry’ and Article 81 of the Federal Law ‘On Joint-Stock Companies,’” the last mile lease term was extended in 20 Russian regions
until July 1, 2029, in the Republic of Buryatia, the Trans-Baikal Territory, the Amur Region, and the Jewish Autonomous Region;
until July 1, 2017, in the Republic of Karelia, the Republic of Marij El, the Republic of Khakassia, the Belgorod Region, the Volgograd Region, the Vologda Region, the Kursk Region, the Lipetsk Region, the Nizhni Novgorod Region, the Rostov Region, the Tambov Region, the Tomsk Region, the Tyumen Region, the Chelyabinsk Region, the Khanty-Mansijsk Autonomous District – Yugra, and the Yamalo- Nenets Autonomous District.
Starting from January 1, 2014, last mile customers pay for electricity distribution services at FGC UES’s tariffs and the cross-subsidy rate determined by the above-mentioned law
The enactment of Federal Law No. 308-FZ of November 6, 2013, enabled territorial grid organizations to reduce the risk of lost income resulting from interrupted electricity consumption; however, additional compensatory measures should be taken to resolve the problem in full.
Overall, the compensatory measures provided for in the applicable laws and carried out in 2014 made it possible to fully settle the issue in 22 constituent entities of the Russian Federation where last mile agreements were entered into before January 1, 2014,
However, the problem remains unresolved in 22 other Russian regions and requires additional compensatory measures.
Program for Disposing of Noncore Assets
ROSSETI’s noncore assets are capital assets and construction- in-progress facilities intended for use other than the generation, transmission, dispatching, and distribution of electricity and heat and also include shares, issue-grade securities convertible into shares, and shareholdings in organizations that are not engaged in the generation, transmission, dispatching, distribution, and retailing of electricity and heat.
Documents that govern the disposal of ROSSETI’s and SDCs’ noncore assets:
- Strategy for Disposing of Noncore Assets of ROSSETI and Subsidiaries and Dependent Companies of ROSSETI (approved by the Board of Directors on June 22, 2010; Minutes of the Meeting No. 37)
- Register (Sale Program) of Noncore Assets of ROSSETI (approved by the Board of Directors on December 30, 2010; Minutes of the Meeting No. 52)
Disposing of noncore assets aims to reduce expenses associated with the maintenance and management of noncore assets, earn proceeds from the sale of such assets, and receive high-quality (exclusive) services supporting the core activities
36 units of the Company’s noncore assets were divided into three groups by method of disposal: sale on a priority basis, sale with deferred disposal, and retained ownership.
It was planned to sell a total of 14 capital assets and construction- in-progress facilities with a net book value of 16.3 million rubles and a shareholding in VNIPIENERGOPROM with a carrying value of 2 million rubles.
All 14 capital assets and construction-in-progress facilities were sold at public auctions in a timely manner, resulting in the proceeds of 12.86 million rubles. In addition, in accordance with the option agreements previously signed with management, stakes in Siberian Energy Scientific and Technical Center and SCPE were sold, with the proceeds from the sale totaling 521 million rubles. A stake in Sibenergosetproekt was written off due to the bankruptcy proceedings against the company.
The sale of noncore assets was not scheduled for 2014.
Simultaneously, the Company worked in 2014 to structure the transaction associated with the sale of shares in VNIPIENERGOPROM on a competitive basis. A decision of the Board of Directors was drafted, and the market value of the shares was appraised to this end. A directive of the Russian Government with respect to its representatives’ voting at a meeting of the Company’s Board of Directors is currently under consideration by executive authorities of the Russian Federation.
Additionally, a decision was prepared and adopted by the Board of Directors of the Company on October 29, 2014, (Minutes of the Meeting No. 168) in relation to the reorganization of the Engineering Center UES Real Estate through its takeover of Urals Power Engineering Company Real Estate, South Center of Power Engineering Real Estate, VNIPIENERGOPROM Real Estate, Volga Power Engineering Center Real Estate, North-West Power Engineering Center Real Estate, and Siberian Energy Scientific and Technical Center Real Estate and with respect to the sale of their real property in order to finance the project to set up the Federal Testing Center intended to conduct a full range of tests on electrical equipment, designs, and technologies.
Progress in selling ROSSETI’s noncore assets was considered by the Board of Directors of the Company on November 18, 2014 (Minutes of the Meeting No. 169).
